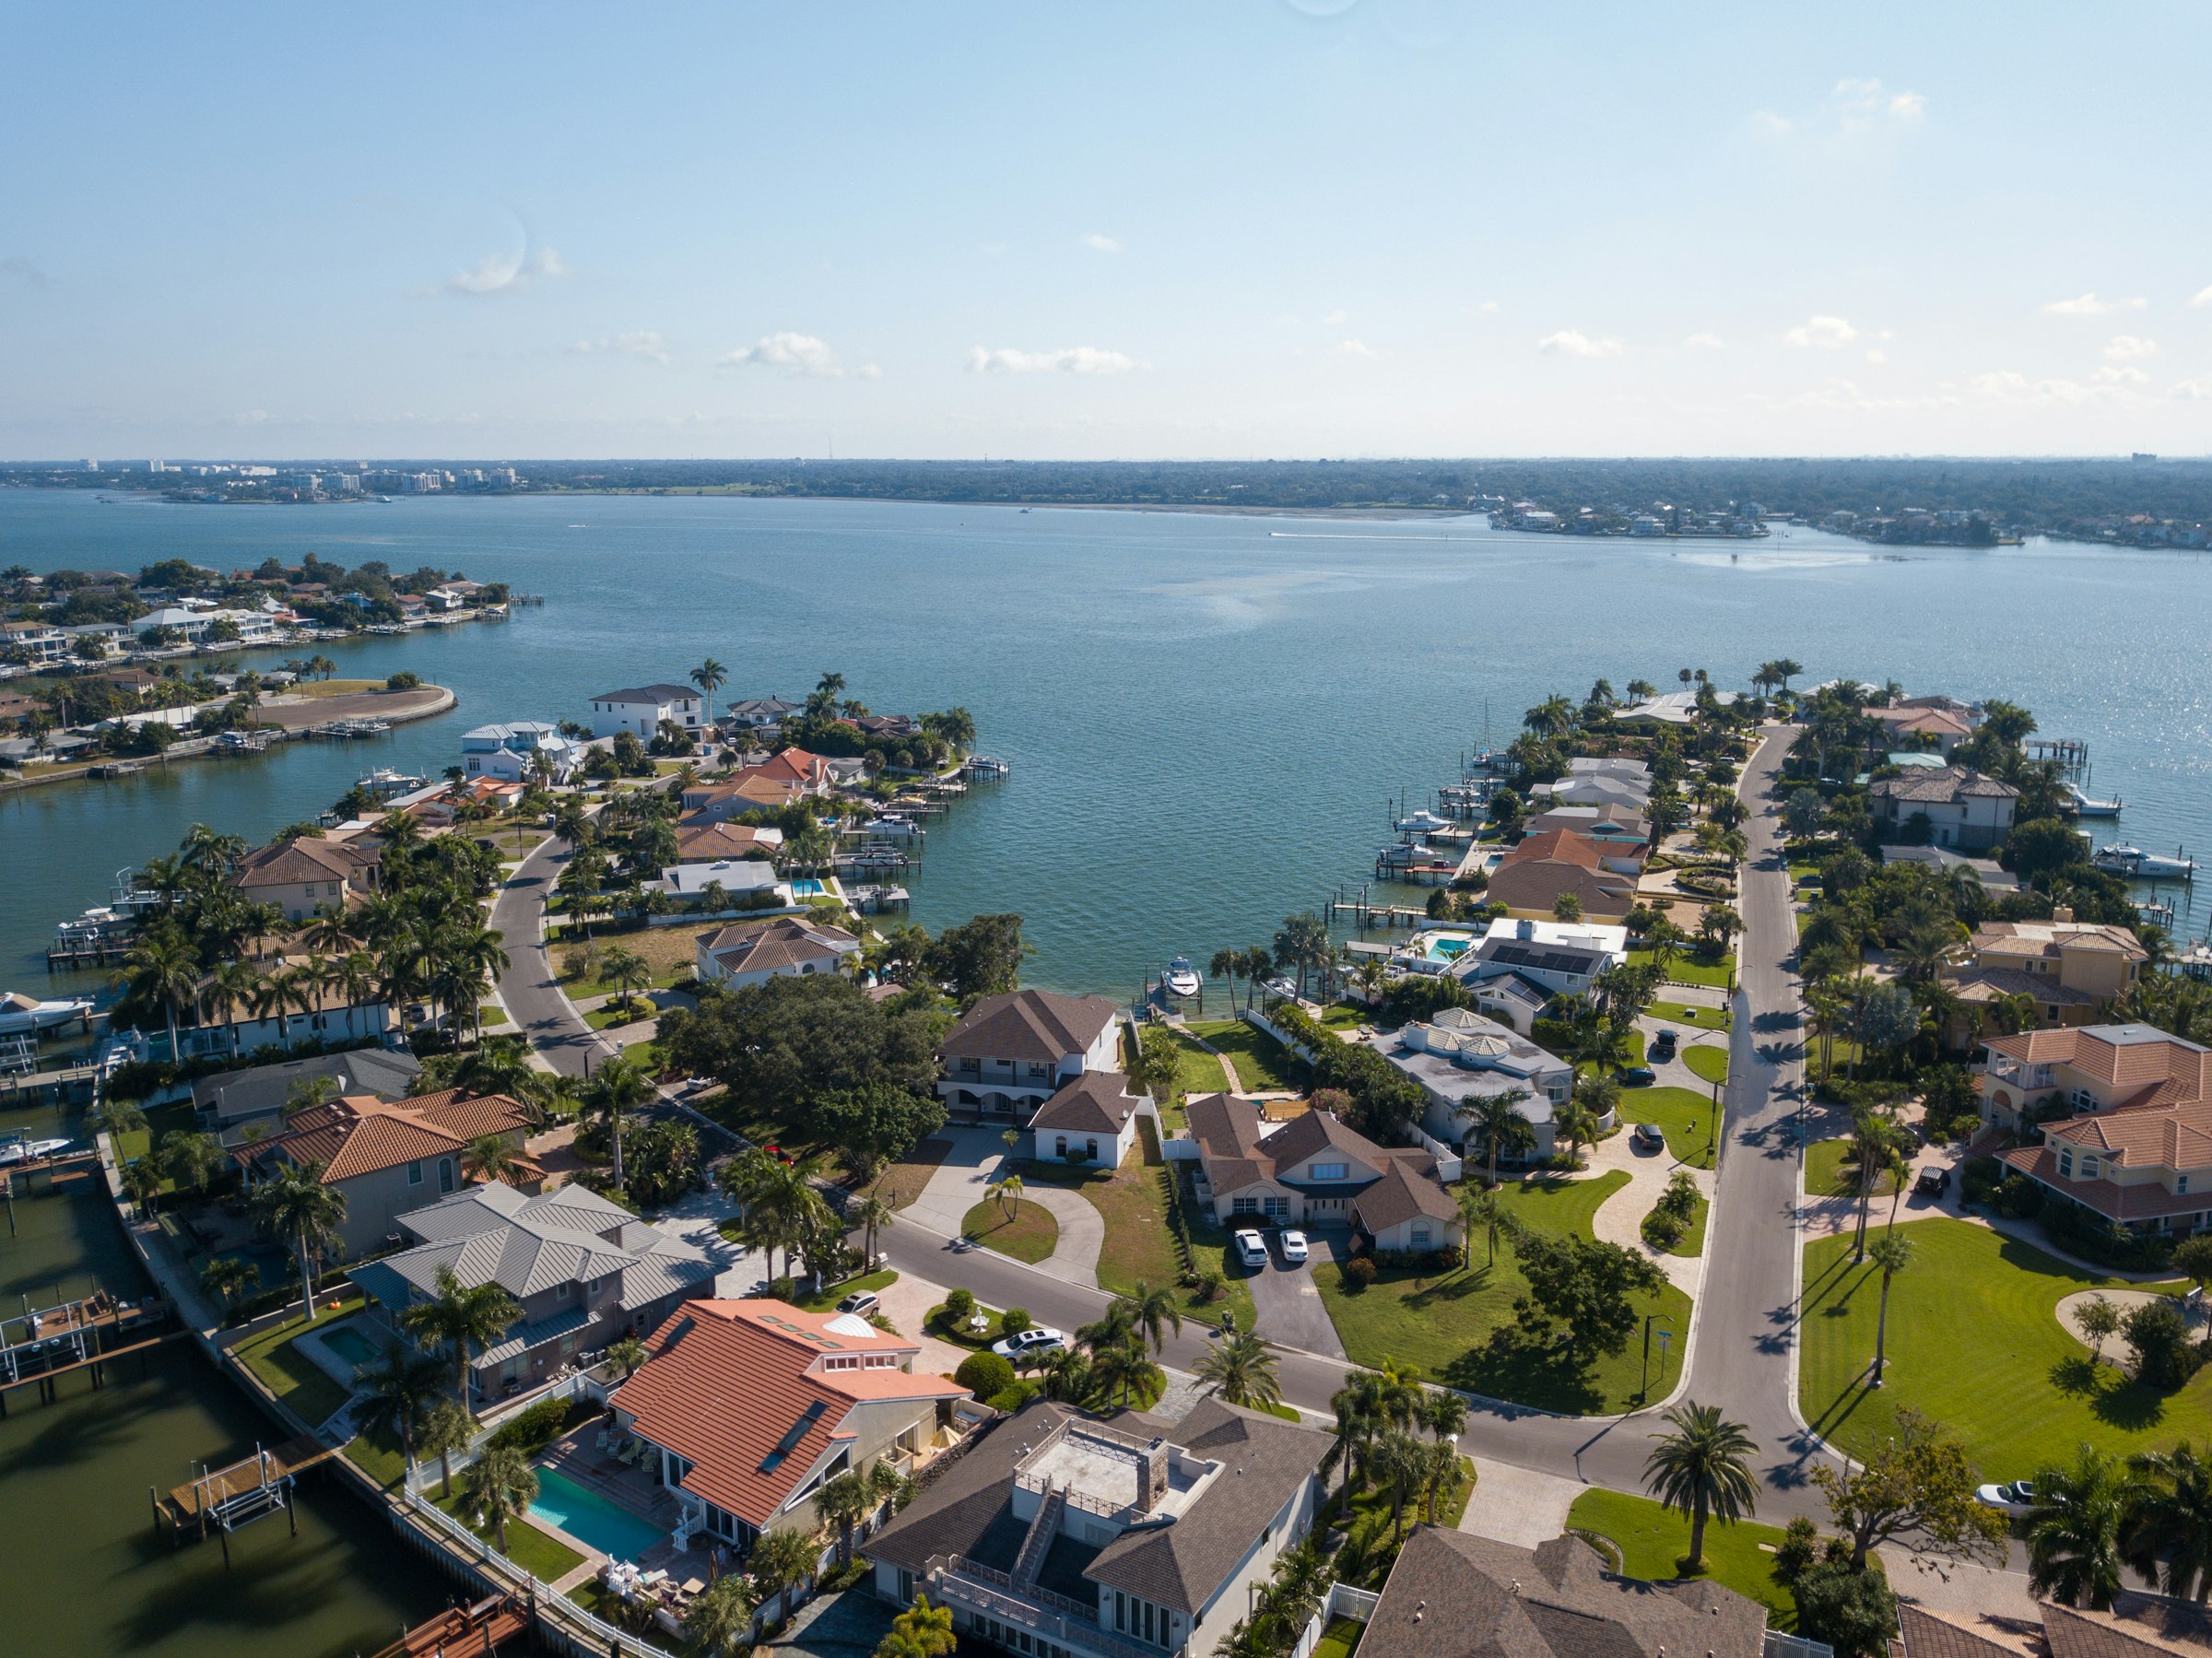
For decades, Florida drew Americans with sunshine, no state income tax and homes near the water. In 2023, that pull was still strong. Of the 219,799 people Redfin counted moving into the country's high-flood-risk counties that year, 117,574, or 53.5 percent, were moving to Florida.
Then the direction changed.
Two years of reversal
Redfin defines a high-flood-risk county as one in the top 10 percent nationally by the share of homes facing major, severe or extreme flood risk, using First Street's property-level scores. In 2023 those counties still took in about 16,000 more domestic movers than they lost.
In 2024 they posted a net outflow for the first time in five years: 34,099 people. In 2025, covering July 2024 to July 2025, the net outflow nearly doubled, to 63,357. Over the same period, counties Redfin classifies as low flood risk gained a net 69,857 residents, their largest gain since 2018. Miami-Dade alone lost a net 72,254 residents to other parts of the country.
Those numbers need two qualifications, both from Redfin's own report. They count domestic movers only; immigration and births are excluded, so a county can lose domestic movers and still grow. And the outflow isn't universal. Of the 310 high-flood-risk counties Redfin analyzed, 182 still had more people moving in than out. Two of the three largest net gains were in Florida: St. Johns County, south of Jacksonville, and Lee County, home to Fort Myers and Cape Coral.
The cost of staying
My read is that people seldom move because of one storm. More often it's the cost of staying, which builds year after year, with insurance as the most visible part of it.
One distinction matters here. A standard homeowners policy doesn't cover flood. Flood coverage is bought separately, often through the National Flood Insurance Program, which has been moving toward property-by-property pricing, as I wrote in The Cost of an Honest Premium. The homeowners premium covers wind, fire and the rest. But many of the counties near the top of Redfin's flood rankings, Miami-Dade, Harris County in Texas and Orleans Parish among them, are hurricane counties too. My read is that their owners are facing both bills at once.
Some of the strongest evidence on what rising homeowners premiums do to home prices comes from two economists, Benjamin Keys and Philip Mulder, in a National Bureau of Economic Research working paper most recently revised in October 2026. They inferred more than 74 million premiums from mortgage escrow payments between 2014 and 2024. Their measure of exposure is hurricane and wildfire risk, not flood. They find that premium increases end up in home values, cutting home price growth by more than $40,000 in the most exposed ZIP codes.
That's a reduction in growth, not a drop in price. In plain terms, homes in those ZIP codes gained about $40,000 less in value than they otherwise would have. The houses didn't necessarily lose value. They just stopped keeping up.
The insurers moved first
My read is that a carrier can leave a market well before buyers do, and that the signal shows up in coverage rather than on the listing. In December 2024, the Democratic majority staff of the Senate Budget Committee published non-renewal data from 23 insurers, covering about two-thirds of the homeowners market from 2018 through 2023. The committee concluded that climate change is driving rising non-renewal rates. It found the highest rates in Florida and named a wider set of affected regions beyond Florida, California, Louisiana and Texas: the Carolinas, New England, Oklahoma, the Northern Rockies and Hawaii.
The industry disputed the framing. At the hearing, a former president of the Insurance Information Institute argued the national figures were skewed by Florida and California and pointed to inflation, litigation, fraud and growth in insured values as drivers. A trade association said non-renewal data alone doesn't link rising losses to climate. Both readings can be partly right. Either way, the non-renewal notice can arrive well before any price cut does. I wrote about who carries that shift in A "Stable" Insurance Market — Stable for Whom?
Where prices still sit
If movers and insurers are responding, have prices caught up? A widely cited estimate says no, or at least not as of the data it used. In a 2023 paper in Nature Climate Change, Jesse Gourevitch and six coauthors estimated that US residential properties exposed to flood risk were overvalued by $121 billion to $237 billion, depending on the discount rate, relative to prices that would fully reflect expected flood damage over 30 years. They found the most overvalued properties concentrated in coastal counties without flood-risk disclosure laws. Most of the overvaluation, 69 percent in dollar terms, sat outside FEMA's official flood zones.
That estimate is a snapshot. It doesn't tell us whether the gap has narrowed since, and it was built before the migration numbers turned. My guess is that some of that gap has begun to close; the estimate itself can't confirm that.
Not a collapse
The price evidence so far is modest. In November 2024, Redfin reported that the total value of homes facing low flood risk had risen 6.7 percent over the previous year, compared with 6.0 percent for homes facing high flood risk. That was part of a broader finding: for the first time since 2010, low-risk homes gained value faster than high-risk ones across all three hazards Redfin tracks: flood, fire and heat. Redfin itself described the differences as small. Homes in high-risk areas were still worth more than 60 percent more than before the pandemic.
A lead of less than a percentage point, measured over one year, isn't a crash. It's a change in direction.
An observation
Put the pieces side by side and, in my reading, they line up in a sequence. Movers shift first. Insurers reprice and pull back. The price data lags, and a widely cited estimate says it hadn't finished adjusting. None of it has required the water to arrive first.
The water hasn't reached these houses. The market has started to.
Sources
- Redfin, Lily Katz and Elijah de la Campa, "Thousands More People Are Moving In Than Out of Fire- and Flood-Prone America, Fueled by Migration to Texas and Florida," August 5, 2024. 2023: 219,799 people moved into high-flood-risk counties, 117,574 (53.5%) to Florida; national net inflow 16,144.
- Redfin, Dana Anderson and Yingqi Xu, "Flood-Prone Parts of America Are Losing Residents at Nearly Twice Last Year's Rate," June 24, 2026, updated June 29, 2026. 2025 (July 2024–July 2025) net domestic outflow of 63,357 from high-flood-risk counties vs 34,099 in 2024; low-flood-risk counties +69,857, largest since 2018; Miami-Dade −72,254; 182 of 310 high-risk counties with net inflows; St. Johns and Lee counties; domestic migration only, excludes immigration; high-risk defined as top 10% by share of homes at major/severe/extreme risk (First Street).
- National Bureau of Economic Research, Benjamin J. Keys and Philip Mulder, "Property Insurance and Disaster Risk: New Evidence from Mortgage Escrow Data," Working Paper 32579, June 2024, revised October 2026. 74 million premiums inferred from escrow, 2014–2024; identification from hurricane and wildfire exposure; premium increases capitalized into home values, reducing home price growth by over $40,000 in the most exposed ZIP codes.
- US Senate Committee on the Budget, "Next to Fall: The Climate-Driven Insurance Crisis Is Here — And Getting Worse," hearing and majority staff report, December 18, 2024. Non-renewal data from 23 insurers, 2018–2023. Findings and industry testimony as reported by Insurance Journal, "Senate Says Climate Is Causing Insurance 'Crisis'; Industry Strikes Back," December 19, 2024.
- Gourevitch, Kousky, Liao, Nolte, Pollack, Porter and Weill, "Unpriced climate risk and the potential consequences of overvaluation in US housing markets," Nature Climate Change 13, 250–257, February 2023. Flood-exposed residential properties overvalued by $121–237 billion depending on discount rate; concentration in coastal counties without disclosure laws; properties outside the SFHA contribute 69% of overvaluation.
- Redfin, Lily Katz and Elijah de la Campa, "Homes With Low Natural Disaster Risk Are Rising in Value Faster Than Homes With High Risk for the First Time in Over a Decade," November 20, 2024. Total value of low-flood-risk homes +6.7% year over year (June 2024 vs June 2023) to $40.2 trillion; high-flood-risk +6.0% to $7.2 trillion; first time since 2010 across heat, flood and fire; "these differences are small, they are notable"; high-risk values up more than 60% since before the pandemic.
Figures current as of October 2026.